
Hypothesis testing in statistics is a method used to assess the validity of a claim or hypothesis about a population parameter, utilizing sample data to make inferences and draw conclusions.
In statistics, researchers depend on hypotheses to make inferences. These are statements that assume that something about a population (a parameter) is true.
But how confident are they that it is true? This is where hypothesis testing comes in…
Hypothesis testing helps you to make an inference about if your specific findings are true or they can be explained by chance.
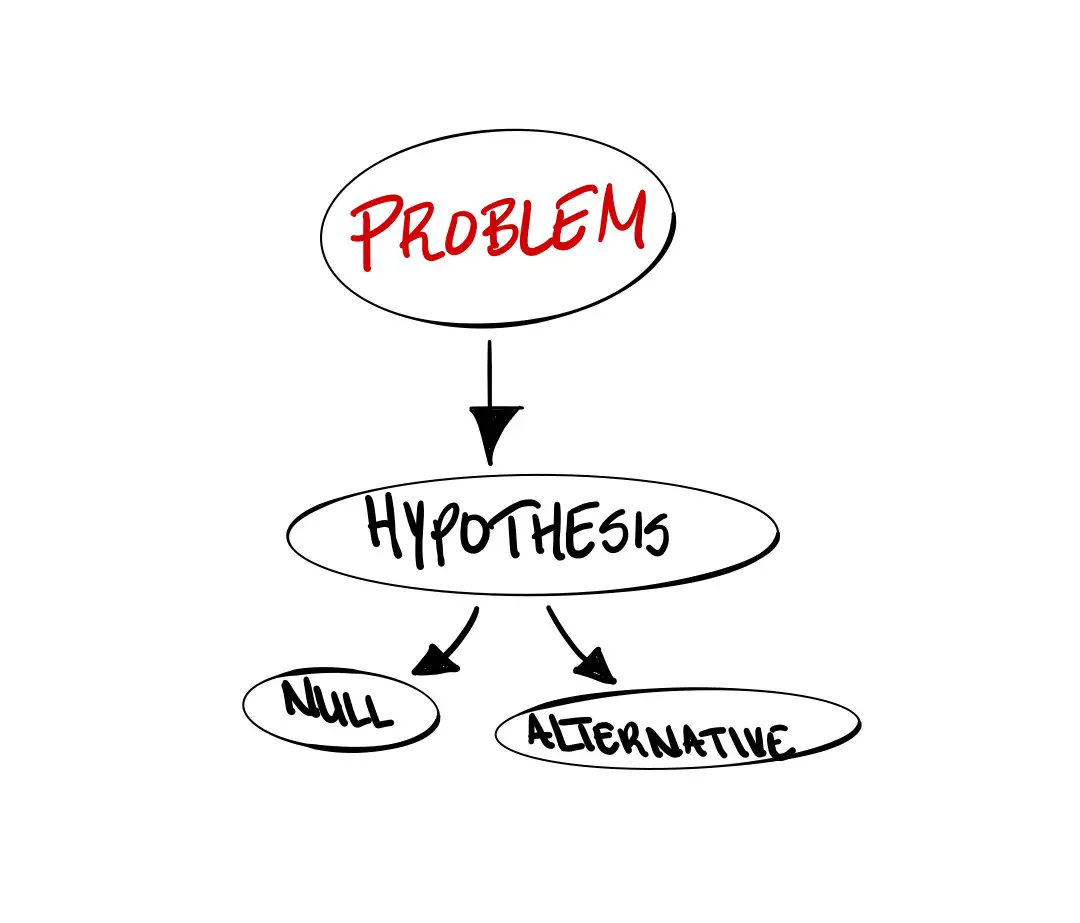
It involves choosing between two competing hypotheses called the null hypothesis and the alternative hypothesis.
The null hypothesis (H0) is the default hypothesis which is usually considered to be true from the outset.
It assumes that the suspected connection between the variables is not real and comes only by chance.
The alternative hypothesis (H1) takes the opposite position that assumes a definite connection. This is your predicted outcome.
Example of Null and Alternative Hypothesis
Null hypothesis, H0: The high death incidence of fish in Grand Lake, Colorado is not caused by mercury pollution.
Alternative Hypothesis, H1: The high death incidence of fish species in Grand Lake, Colorado is caused by mercury pollution.
As you can see, H0 claims that there is no relationship between fish deaths and mercury pollution. H1 claims just the opposite.
Since the two hypotheses make opposing claims, they are mutually exclusive.
Through hypothesis testing, we want to know if enough evidence can be found to reject the null hypothesis and therefore support the alternative hypothesis.
If not, the null hypothesis remains valid. To do this, we use sample data.
Specifically, our hypothesis test asks: Is the connection (relationship) significant (real) or just a case of chance?
The Hypothesis Testing Process

When performing hypothesis testing, researchers go through 4 essential steps:
- Come up with the hypotheses: State your null hypothesis and alternative hypothesis.
- Decide on your significance level: Pick your significance level which usually can be anything from probability values 0.01 to 0.05 to 0.1. This is what you are aiming for.
- Calculate the p-value: The p-value or probability value (that will come from your data) tells you whether the evidence is sufficient to support a null hypothesis. Thelower it is, the more likely the observed value is not by chance.
- Make your conclusion: To reject your null hypothesis, your p-value would have been less than your significance level.
Since we can never be sure that our conclusions are true—as the findings are based on a sample, not the population—our decisions are based on probabilities.
So, we can only say that our conclusion is most likely true but not completely certain.
This is because even when you hope your conclusions were right, you could have committed either of these errors:
- Type 1 Error: (also called a false positive) where you have rejected a null hypothesis even though it’s actually true
- Type 2 Error: (also called a false negative) where you have rejected the alternative hypothesis even though it’s true
Using the steps, we have identified above for formulating and validating hypotheses.
Here are 8 examples of Hypothesis Testing that can be done in real life.
1. Vaccination levels vs death rate from COVID-19

In a bid to curb COVID-19 mortality, governments want to understand if vaccination levels can reduce deaths.
We can look at hospital data and compare COVID-19 patients who are unvaccinated and vaccinated and their death rates.
H0 – vaccinated people are just as likely to die as the unvaccinated
H1 – vaccinated people are more likely to die than unvaccinated.
The significance level is 0.25
P-value – The p-value is calculated as 0.05 (lower than significance level) so we reject H0.
2. Ad Budget Allocation

A tech company wants to know which gender among its online customers is its biggest purchaser. This will help it determine whether to direct its ads mostly towards men or women.
The market director believes men are the biggest buyers. To test this, sample data is collected.
H0: male and females are equally likely to purchase online tech goods
H1: the average purchase by each gender is significantly different (more men buyers)
The significance level is set at 0.05.
If the p-value is found to be 0.038, the null hypothesis is rejected since the p-value is less than the significance level.
3. Engineering Material Science

Determining Brinell Hardness Scores of metals is important for engineers.
It gives the hardness of a metal.
From a huge collection, a sample of metal pieces was tested. The engineer assumed that they would give a hardness score of 170.
H0: mean =170
H1: mean >170
If P-value was 0.11 and the engineer had set a significance level at 0.05, he would reject the null hypothesis.
4. Testing Energy Use Efficiency

An inventor wants to test his lawnmower for energy efficiency. He believes it can run on just 1 gallon of gasoline for 300 minutes. From a large cache of engines he randomly selects a sample for testing.
H0: running time is less than 300 minutes
H1: running time is equal to or more than 300 minutes
Significance level: 0.05
If he measures P-value to be 0.08, this makes it greater than the significance level, so he would not reject the null hypothesis. His machine is not energy efficient.
5. Market Reception Of New Product

Businesses sometimes want to know why a product introduced to the market failed.
For example, a company wants to know if poor ergonomic design resulted in accountants resisting a new financial information system meant for productivity improvement.
H0: ergonomic design not cause of rejection
H1: ergonomic design is the cause of the rejection
Significance level – 0.05
P-value was found to be 0.09 which is higher than the significance level. So, the company will not reject the null hypothesis.
6. Brand Recognition

Brand value and recognition is a powerful asset which makes a company competitive against rivals.
A business wants to gauge the impact of its recent ad campaign on brand recognition which it believes was successful on at least 40% of the target market. It surveys the market.
H0: percentage of recognition in the market: less than 40
H1: percentage of recognition in the market: 40 or more
Significance level – 0.05
If P-value is 0.07, we do not reject H0 and conclude that the brand recognition is low.
7. Shopping Best Price

A computer supplier claimed that all computers sell at an average price of $1,005.
As the representative of a large consumer group, you think it’s actually lower so you carry out a price check of a random sample of vendors.
H0: price=$1005 or higher
H1: average p is lower than $1005
Significance level=0.05
If the p-value is measured at 0.12, it means you don’t reject the null hypothesis.
8. Food Quality control

A bakery’s recipe for its bread aims to have 5 grams of fat in each serving. Its quality control department runs a sample to test for quality conformity.
H0: grams per serving =7 g
H1: grams per serving not equal to 7g
The level of significance is 0.05
If the p-value is 0.04, this means the null hypothesis should be rejected.
Conclusion
There you have it; 8 examples of hypothesis testing in real life.
Hypothesis testing is a very important step for researchers to validate their research findings and support decision-making.
It helps them to establish theories either by maintaining a null hypothesis or advancing new ones called alternative hypotheses.
Related Post: Null and Alternative Hypothesis Examples