Being faced with many numbers can be overwhelming. It makes sense to try and find a number that is representative of the data you’re looking at.
This is where average comes in. Average in mathematics is a value that is a representation of all the numbers in a data set.
Average or mean isn’t always the middle number. The average of a data set is determined by adding all the values in the data set and dividing them by how many numbers were in the data set.
NOTE: When we say average, we don’t mean that every item in the group has that value. Some will have more or less than this value.
Average can be found in a number of ways such as mean, mode, or median.
However, the most commonly used average is simply the mean which is also known as the arithmetic mean.
To find the arithmetic mean, we add all the numbers and divide the result by the number of items.
For example, the average weight of a number of people will be:
Total weight/total number of people
The average gives you a general idea of what the general data set looked like.
Examples of How Average Is Applied In Everyday Life
1. Speed

How fast did you drive from City A to City B? Speed is often given as an average.
It is obtained by dividing the total distance covered by the total time it took to travel over the distance.
Your average speed doesn’t show your speed at specific points in your journey.
It instead gives a general idea of how fast you were driving.
2. Monthly Spending

Knowing how much you spend every month is vital for creating a budget. However, you may spend more in one month than you will in another.
Your average monthly spend can be obtained by dividing your total spend over a specified period e.g. 12 months and dividing this by the number of months in the period (12).
You can use your average spend to determine your monthly budget and find ways to cut back on spending.
3. Temperature Measurements

Meteorologists use the average temperature of the air to predict how the weather will be in the coming days.
This value is obtained by taking temperature measurements every hour over a day e.g. 24 hours and dividing the temperature values by the number of hours.
This temperature is presented as the average temperature for the day.
4. Batting Average

In some sports such as baseball, it’s popular to use the batting average to rate a player.
This gives the offensive skill and competitive level of a player.
It is obtained by dividing the player’s number of hits by the number of at-bats.
The player’s hits, which are also known as base hits, are obtained by adding up singles, triples, and home runs.
The player’s at-bats give the total attempts by the player at a hit.
For example, if the player made 80 hits and 150 at-bats, his batting average would be 80/150 =0.533
5. Representing Age In A Group

How old are the people that attend a class offered at a college? Marketers, program managers, and other professionals use average age to determine who their target audience is.
The ages of the people in the group is added and divided by the number of people in the group.
This information helps them learn more about their audience and how best to serve them.
6. Representing player or team statistics

Average is often used when representing player or team statistics.
You can see the average number of layups that a player made last season per game.
Or the average number of 3 point shots made by a team per game during the previous season.
These numbers help coaches and team managers determine the best strategy for upcoming games.
They also help fans better understand their team or favorite players and decisions that the team makes.
7. Representing performance of students in a class

Educators use the average value to represent the performance of their classes.
The average score in a test will give the educator an idea of the general performance of the class as a whole.
It is obtained by dividing the sum of the scores of all students by the number of students in the class.
This value can be compared to the average of previous years and educators can determine whether adjustments are needed in their approach.
8. Consumption of fuel when driving

You can decide how much fuel to buy for a road trip by determining the average amount of fuel your vehicle consumes.
This can be determined by dividing the number of gallons of fuel used by the distance traveled.
This figure gives you an idea of the general consumption of your vehicle and not the exact amount of fuel that it consumes on every trip.
9. Determining the value of missing data

Sometimes you can be given the average of a group along with some data values but with some data values missing.
The figure given for average can help you to discover the missing data.
For example, if the average weight of 4 people is given as 55 kg and 3 of them are known to weigh 43kg, 54kg, and 90kg, then the fourth person’s weight can be calculated this way:
Mean weight = (sum of weights)/4
55= (43 + 54 + 90 + x)/4
55= (187 + x)/4
220=187 +x
x= 33
Therefore, the missing data is 33
10. Determining Healthy Choices

Health experts usually want to recommend healthy choices for people to follow.
For example, they may be want to know the average number of sleeping hours that is considered healthy.
To do this, they can collect sample data of the sleeping hours of different groups of people and relate this to the incidence of health problems such as hypertension, dementia, or diabetes.
If the average sleeping hours in different groups of people are found to be different, they can infer an association with sleeping hours.
For example, researchers have found a link between Alzheimer’s incidence and sleep deprivation.
Therefore, they recommend an average of 7 hours of sleep for a healthy life.
11. Horse Speed Rates

Horse race lovers usually want to know a horse’s speed rate.
These are usually obtained from a speed index that is calculated using averages.
An average racehorse is considered to have a speed averaging 40-44 mph or 64-70 km/h.
To calculate the speed index, a horse’s fastest winning speeds over the last three years are averaged.
The higher the speed, the higher the horse is valued. Figures exceeding 90 are considered excellent.
This information can be important for prospective horse buyers and bettors.
12. Production in manufacturing

Manufacturing companies represent the number of products they produce in a week, month or year as an average.
This value is obtained by dividing the total number of products for a period (e.g. 4 weeks) by the number of values obtained (in this case 4).
This gives manufacturer a general view of their production performance.
Comparing this value with the average obtained for other periods helps the manufacturer determine whether adjustments need to be made.
13. Adjusting Insurance Premium Rates

Insurance analysts use average to adjust insurance premium rates.
For example, analysts may calculate the average number of accidents for people within a specific age group.
If the average number of accidents within the year for that age group is high, the premium rates for drivers in that age group will be adjusted up as they will be considered a high risk group.
14. Deciding salary levels

Human resource managers often rely on average to determine the salary they should offer a new employee.
They will use the average salary of individuals in the same field and with the same level of experience to determine what a good salary offer is.
15. Weighted Average
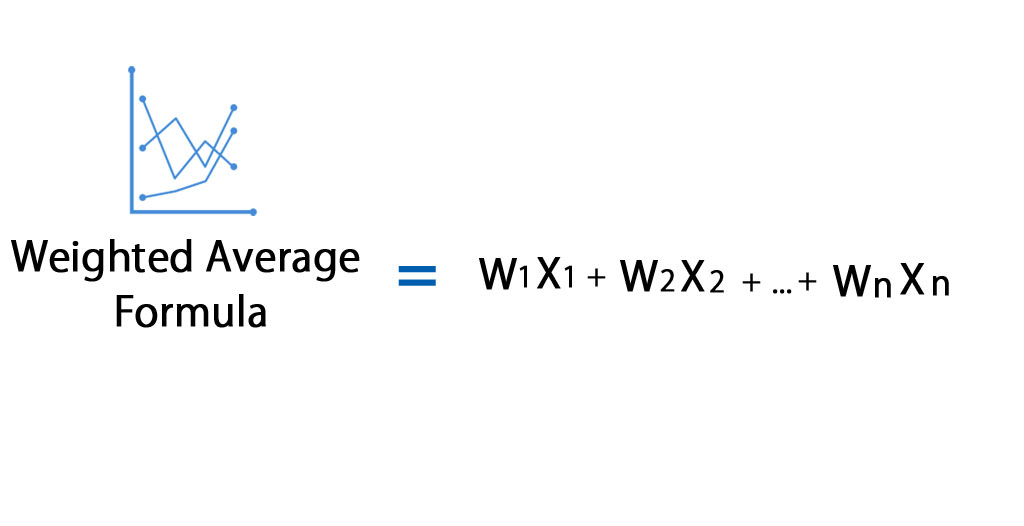
In some cases, giving each data point the same level of importance can be misleading.
That is because some data is more important than others.
Using weighted averages can give you a more accurate picture than ordinary averages.
For example, we can calculate the weighted average price of a computer from the following computer store which has 3 batches of computers with different prices.
Batch 1: 200 computers costing $1 each
Batch 2: 150 computers costing $2 each
Batch 3: 50 computers costing $1.15 each
Since the computers don’t all cost the same price, we give each batch a different weight using their number of units as the weights:
Weighted average= total weighted cost/total units= (200 x $1 + 150 x $2 + 50 x $1.15)/(200+150+50)
$707.5/400 units = $1.77
Therefore, the weighted average price of the computers is $1.77
Parting Thoughts
We use average to help us understand trends and behaviors in the world around us. The above are only a handful of examples of this.
Image sources: 1, 2