Before studying nonlinear relationships, you likely were introduced to linear relationships. This introduction gives you a much simpler way of creating and using predictive models.
However, without studying nonlinear relationships, much of the world around us would not be understood.
That is because most physical and statistical situations in the real world are nonlinear and not linear.
Therefore, statisticians, scientists, and engineers rely on nonlinear analysis to make sense of many things.
In a nonlinear relationship, varying the independent variable X does not produce a constant change in the dependent variable Y – as it does in linear relationships.
If for example, you double one variable, the other variable is not doubled.
This means that while linear relationships will generate a straight line when plotted on a graph, non-linear relationships will produce a curve.
Types of non-linear relationships
There are many examples of non-linear relationships. A few of these include:
- Quadratic
- Cubic
- Exponential
- Cyclic or periodic
- Quartic
- Rational
- Hyperbolic
- Logarithmic
When the data points of a nonlinear relationship are plotted on a graph, it will produce a trend line that may conform to any of the above examples.
Importance of Non-Linear Relationships
At first, scientists thought that linear relationships held true for many things. However, many of these turned out to be approximations.
For example, Newton’s laws of mechanics were only later found to hold under certain conditions.
Through the more accurate theory of relativity proposed by Albert Einstein, we have learned that some values such as space and time can be very different when one is moving at the speed of light.
Many other complex phenomena like chaos and turbulence are more suited to non-linear analysis than linear.
Here are 10 examples of non-linear relationships in real life:
1. Balloon volume vs radius

If you inflate a balloon and take data of its radiuses at various volume levels, you will get a nonlinear relationship. This is also described as a cubic relationship.
2. Amount of exercise vs weight loss

It is often believed that the more effort one puts into working out, the more one should lose weight.
However, this may not hold. Sometimes, doubling your exercise may not lead to an equivalent reducing effect on weight.
3. Amount of a radioactive element remaining vs time

How long will it take for a given amount of uranium to deplete?
This can be modeled by getting data on the mass of the matters left and the time elapsed.
The result is a non-linear relationship between the variables
4. Height of sea tides vs time

If we plot the heights of the low and high tide of the sea and relate it with time, it produces a nonlinear relationship.
This is called a cyclic or periodic relationship because its curve has a repetitive sequential shape.
The curve uses trigonometry (sine and cosine) to model this relationship.
5. Geometric Relationship
Geometric relationships are ones where you produce a geometric sequence such as 1, 8,27, 64…
If we take our independent variables of 1, 2, 3 and order them with the dependent variables of 8,27, 64…it will reveal a nonlinear relationship.
6. Relating area and the side of a square
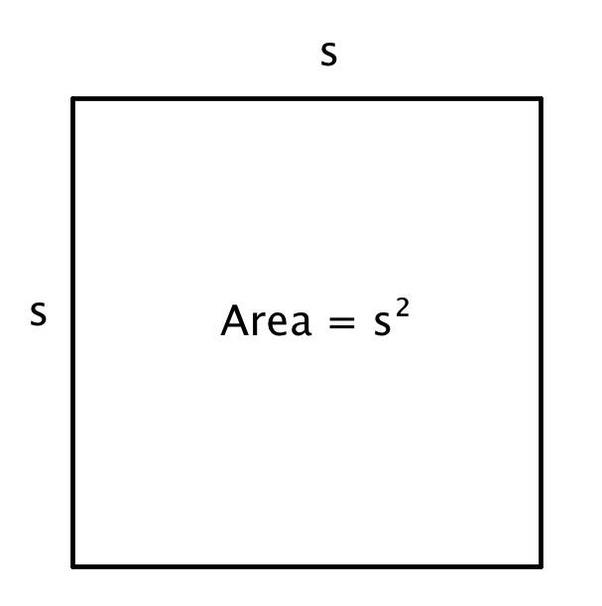
If you take the side of your square as the independent variable X and area Y as the dependent variable, we can plot your data which will obtain a curve showing a nonlinear relationship.
The relationship will be found to be a quadratic relationship rather than a linear one.
7. Charging a capacitor
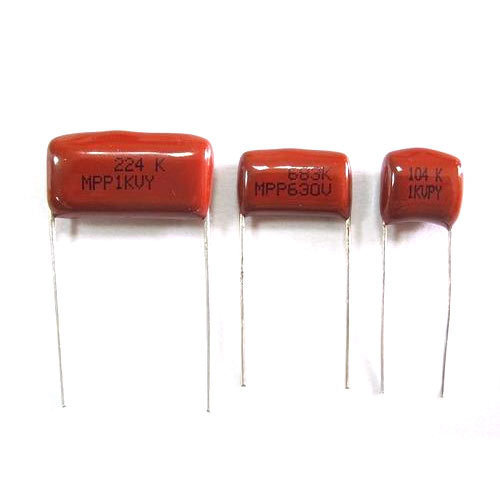
A capacitor is a device that stores energy. After discharging, it needs to be recharged.
What kind of relationship holds between the charge and the time it takes to charge?
You can plot the data and investigate. It will be found that the charge and time have a nonlinear relationship.
For example, the charge does not double after two seconds compared to what its level was after one second.
8. Relating pressure and volume of a gas
If you vary the pressure of a gas in a container and compare it to the volume, you will get a nonlinear relationship.
9. Relating the area of a circle and radius
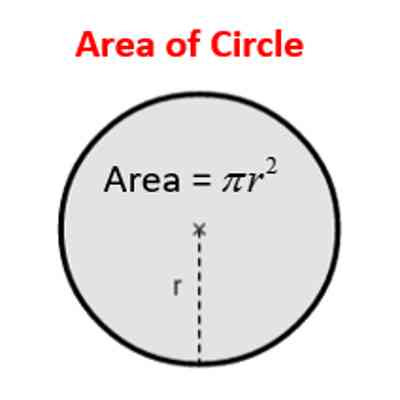
When you relate the area of a circle to its radius, it will give you a nonlinear relationship.
This curve shows a quadratic relationship with radius as the independent variable and the area of the dependent variable
10. Relating energy of a moving object and its velocity

How much energy does an object have due to its motion?
If you plot the energy that a body has against the velocity, you get a nonlinear relationship. This is represented as a curve on a graph that is quadratic in nature.
Conclusion
Non-linear relationships are more complex than linear relationships.
However, they deserve to be studied as they reflect a lot of real-world realities which can’t be understood as linear modeling. Most things in nature are nonlinear.
