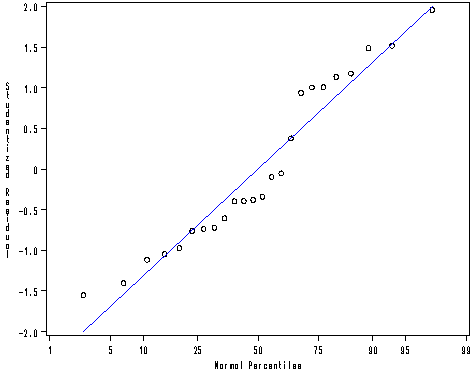
A linear model is an equation that is used to compare two values i.e. x and y.
In linear models, the change between the two values is consistent. This means that the x changes at the same rate in which y changes.
These equations can be represented on a graph using a straight line, hence the name linear. They are the simplest type of model in mathematics.
Here are examples of linear models in real life:
1. The relationship between boiling point of water and change in altitude

The boiling point of water varies with changes in altitude. You can determine the boiling point at a given altitude using the linear equation:
Boiling point = β0 + β1
Where β0 is the expected boiling point without a change in altitude and β1 is the rate of change in boiling point when the altitude changes by one unit.
2. Determining the relationship between spending on advertising and revenue

Many companies have a marketing budget. In marketing, it is expected that companies that spend more on advertising will attract more revenue. This is represented in the linear model:
Total revenue = βo + β1
Whereβ0 is the total expected revenue without spending on advertising and β1 is the average change in total revenue when spending on advertisements is increased by a single unit e.g. by a dollar.
Using this linear model, companies can decide by how much they would need to increase the spending on advertising and how much they should expect as revenue as a result.
3. Drug dosage and response

Medical researchers use linear models to understand the relationship between the dosage of a drug and the response of patients.
Researchers may administer a dose and observe the patient’s reaction. They will change dosage and keep observing the patient’s reaction to determine the optimum dosage. This relationship can be represented as follows:
Patient’s response = β0 + β1
Β0 is the response when the dosage is zero. β1represents the average change in the patient’s response when the dosage of the drug given to the patient is increased by a unit.
4. The relationship between the amount of fertilizer used and crop yields

Agriculturalists help farmers determine the optimum amount of fertilizer to use to get high crop yields using linear equations. They often use linear models such as:
Total Crop Yield = β0 + β1.
In this linear equation β0 is the expected crop yield with the use of fertilizer. β1is the average change in crop yield when the amount of fertilizer used on the field is increased by one unit and all other factors remain constant.
The agriculturalist may advise farmers to change the amount of fertilizer they use to maximize their crop yield.
5. Performance of athletes and their training regimen

Professional sports teams and trainers use linear models to assess the efficacy of the training regimens used on professional athletes.
They use these equations to express the relationship between the performance of the athlete and changes in their training regimen.
For example, a linear model may be used to show the relationship between weight lifting and the number of rebounds a player in basketball is able to pick per game.
The rebounds per game= β0 + β1
Where β0 is the number of rebounds the player is expected to pick without weight training and β1 is the change in the number of rebounds picked when weight training sessions are increased by one.
This equation assumes that training sessions remain constant from one week to the next.
6. Predicting population growth over time

Statisticians use linear models to predict population growth in a given region such as a town or even countries.
The two variables are time and population size. The population growth for a specific period can be predicted using the linear equation:
Total population = β0 + β1
Where β0 is the initial or current population and β1 is the rate of change of the population after each year.
7. Relationship between height and weight

The relationship between height and weight can be represented using the linear model
Body weight = β0 + β1
Where β0 is the starting or reference weight of a person at average height and β1 is the rate of change in weight with an increase in height of one unit. This equation can be used to estimate an individual’s weight when their height is known.
8. The relationship between income and education/experience

Linear models can be used to express the relationship between years of experience or education levels and income. This can be expressed as:
Income = β0 + β1 + β2
Where β0 is the expected minimum income level, β1 is the rate in change of income with a change in education level and β2 is the rate in change of income with a change in experience.
If everything else remains constant, higher levels in education and more experience should attract higher income.
Linear models are an important part of everyday life. They are used in every day as a means to predict outcomes.
Image source: 1, 2

