7 Instantaneous Rate of Change Real Life Examples
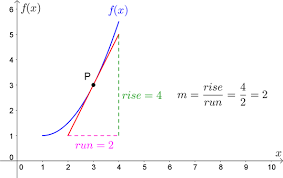
The relationship between two variables can be represented graphically. When the rate of change for both variables is constant, the relationship between these two variables is represented by a straight line. When the rate of change is constantly varying, the relationship between the two variables is represented graphically by a curve. Instantaneous rate of change …

